📊 April 2026 Update: This analysis has been reviewed with the latest available MLIT transaction data. Last reviewed: April 2026.
Key Takeaways
- Tokyo commands 40–60% higher prices per m² than Osaka for comparable locations
- Osaka delivers higher gross yields (5.0–7.0%) vs. Tokyo (3.0–5.0%)
- Tokyo has deeper liquidity — more transactions, faster sales, more buyer competition
- Osaka's price appreciation has outpaced Tokyo in percentage terms over the past 3 years
- Both cities are legitimate investment markets — the right choice depends on your strategy
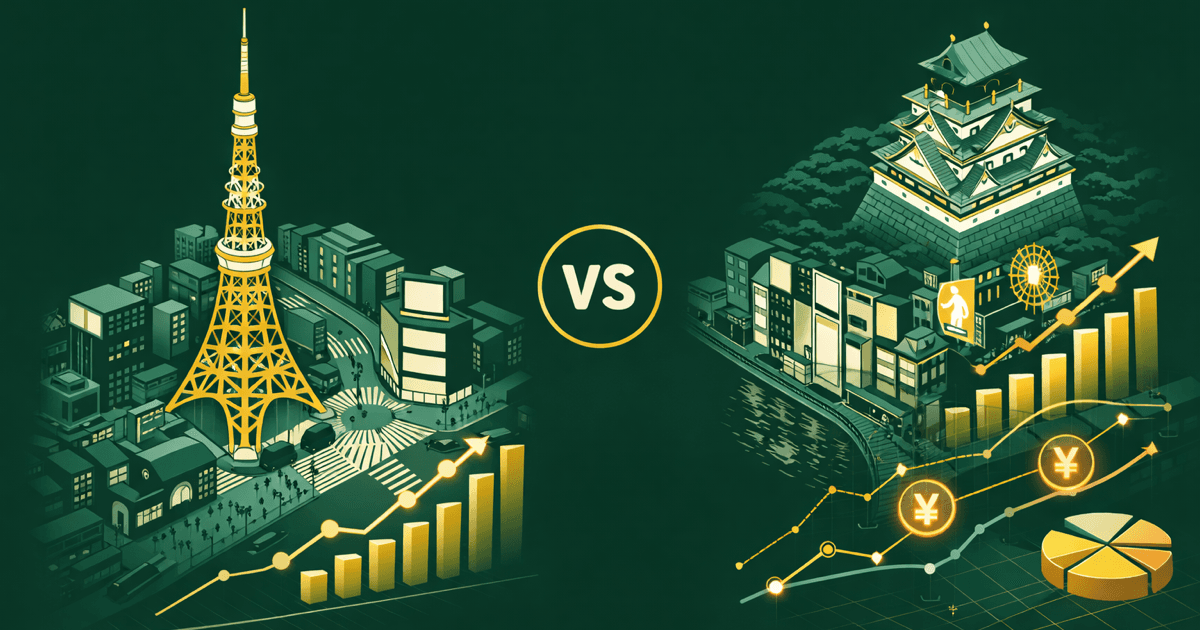
Two Cities, Two Investment Profiles
Tokyo and Osaka are Japan's dominant property markets, but they serve different investor needs. Tokyo is the undisputed financial capital with the world's largest metropolitan economy. Osaka is Japan's commercial second city — historically the nation's merchant hub — with a distinct culture, lower entry prices, and a growing international profile.
This comparison draws on official MLIT (Ministry of Land, Infrastructure, Transport and Tourism) transaction data available through our platform, supplemented by market-level observations for context.
Price Per Square Meter Comparison
Based on condominium transactions recorded in MLIT data:
| Location | Median Price/m² | Relative to Tokyo Average |
|---|---|---|
| Tokyo: Minato-ku | ~¥1,550,000 | Baseline (premium) |
| Tokyo: Shinjuku | ~¥1,350,000 | –13% |
| Tokyo: Shibuya | ~¥1,480,000 | –5% |
| Tokyo: Meguro | ~¥1,100,000 | –29% |
| Osaka: Kita-ku (Umeda) | ~¥650,000 | –58% |
| Osaka: Chuo-ku (Namba) | ~¥580,000 | –63% |
The price gap is substantial. A ¥50M budget buys approximately 37 m² in central Tokyo (Shinjuku) versus 77 m² in central Osaka (Umeda) — more than double the floor area.
💡 View live transaction data for Tokyo (Shinjuku) and Osaka (Umeda) on our platform
Transaction Volume
Transaction volume reflects market liquidity — how easily you can buy and sell:
| Metric | Tokyo (23 Wards) | Osaka (Central) |
|---|---|---|
| Annual condo transactions | ~45,000+ | ~12,000+ |
| Average days on market | 30–60 | 45–90 |
| Foreign buyer activity | High | Growing |
Tokyo's transaction volume is roughly 3–4x Osaka's, reflecting its larger population and deeper international investor presence. This translates to faster sales when exiting your investment.
Rental Yield Comparison
Gross rental yields by district, based on asking rents vs. transaction prices:
| Location | Typical Gross Yield | Entry Price (25 m² unit) |
|---|---|---|
| Tokyo: Shinjuku | 3.5–5.0% | ¥30–40M |
| Tokyo: Shibuya | 3.5–4.5% | ¥35–45M |
| Tokyo: Minato | 3.0–4.0% | ¥40–55M |
| Osaka: Kita (Umeda) | 5.0–6.5% | ¥15–22M |
| Osaka: Chuo (Namba) | 5.5–7.0% | ¥12–20M |
Osaka's yield advantage is clear. The combination of lower purchase prices and competitive rental demand (driven by the city's large service sector workforce) produces gross yields 1.5–2.5 percentage points higher than Tokyo equivalents.
Net yields after expenses (management fees, taxes, vacancy) show a similar spread.
Price Trend Analysis (3–5 Years)
Tokyo
Central Tokyo condominium prices have risen steadily:
- 3-year change: +15–22% (ward-dependent)
- Key drivers: Post-pandemic office return, foreign investment inflows, weak yen, limited new supply in central wards
- Outlook: Moderate continued appreciation. Tokyo prices are approaching levels where yield compression limits further gains for income investors.
Osaka
Osaka has experienced stronger percentage growth from a lower base:
- 3-year change: +12–19% (ward-dependent)
- Key drivers: Tourism recovery (Osaka hosted 11M+ international visitors pre-pandemic), 2025 Expo momentum, corporate relocations from Tokyo, Umeda redevelopment
- Outlook: Growth may moderate as the Expo effect is priced in, but Osaka's fundamentals remain strong.
📊 Compare historical price trends using our Shinjuku and Umeda / Kita analysis pages
Infrastructure and Development
Tokyo
- Shinjuku Station redevelopment (through 2040): Modernizing the world's busiest station complex
- Shibuya Station area: Multi-phase project adding 500,000+ m² of commercial/residential space
- Toranomon-Azabudai Hills: Completed 2023, reshaping Minato-ku
- Shinagawa maglev terminal: Future Chuo Shinkansen (timeline uncertain)
Osaka
- Umeda 2nd Project: Major mixed-use development in Kita-ku
- Yumeshima IR: Integrated resort (casino) project — potential tourism catalyst
- Namba redevelopment: Ongoing modernization of the southern hub
- Shin-Osaka Station expansion: Plans for a broader transport hub
Both cities have substantial development pipelines, but Osaka's projects represent a more transformative change relative to the city's current scale.
Demand Drivers
| Factor | Tokyo | Osaka |
|---|---|---|
| Population trend | Growing (domestic migration to central wards) | Stable to slight growth |
| Corporate headquarters | Dominant (#1 in Japan) | Strong (#2, growing with relocations) |
| International tourism | High | Very high (key gateway for Kansai) |
| Student population | Very large (100+ universities) | Large (major university city) |
| Expatriate community | Large and established | Smaller but growing |
Tokyo's demand is broader and more diversified. Osaka's demand is increasingly tourism-driven, which adds both opportunity and cyclicality.
Risk Comparison
| Risk Factor | Tokyo | Osaka |
|---|---|---|
| Price correction risk | Moderate (prices near cycle highs) | Lower (more room for growth) |
| Liquidity risk | Low | Moderate |
| Vacancy risk | Low (2–4%) | Low-moderate (3–5%) |
| Currency impact | Same | Same |
| Natural disaster | Earthquake focus | Earthquake + typhoon/flooding |
| Regulatory change | Same national framework | Same national framework |
Cost of Entry Comparison
For a typical investment scenario — purchasing a compact (25 m²) condominium:
| Cost Item | Tokyo (Shinjuku) | Osaka (Umeda) |
|---|---|---|
| Purchase price | ~¥35,000,000 | ~¥17,000,000 |
| Agent commission | ~¥1,221,000 | ~¥627,000 |
| Registration + taxes | ~¥500,000 | ~¥250,000 |
| Total investment | ~¥37,000,000 | ~¥18,000,000 |
| Monthly rent (est.) | ~¥120,000 | ~¥75,000 |
| Gross yield | ~4.1% | ~5.3% |
An investor with a ¥35M budget can buy one unit in central Tokyo or two units in central Osaka — diversifying across properties and potentially across sub-markets.
Which City Fits Your Investment Goals?
Choose Tokyo If You:
- Prioritize liquidity and ease of exit
- Want exposure to the world's largest metro economy
- Prefer lower vacancy risk and broader tenant demand
- Are building a premium portfolio with blue-chip assets
- Plan to hold long-term (5+ years) for steady appreciation
- Value the established expatriate community and English-language support infrastructure
Choose Osaka If You:
- Prioritize higher yields and cash flow
- Want lower entry prices and the ability to buy multiple units
- Believe in tourism-driven growth and the Kansai region's development trajectory
- Are comfortable with slightly less liquidity
- Want diversification away from the Tokyo-concentrated Japan portfolio
- See value in Osaka's earlier stage of the investment cycle
Consider Both If You:
- Are building a diversified Japan portfolio and want exposure to both markets
- Want to balance yield (Osaka) with stability (Tokyo)
- Have sufficient capital to maintain properties in both cities
Frequently Asked Questions
Is Osaka riskier than Tokyo?
Osaka carries slightly higher liquidity risk and is more sensitive to tourism cycles. However, its lower entry prices and higher yields provide a margin of safety that Tokyo's compressed yields do not.
Can I manage properties in both cities?
Yes. National property management companies operate in both Tokyo and Osaka. You can also use separate local managers in each city. Remote management is standard for both markets.
Which city is better for a first-time Japan investor?
For first-time investors, Tokyo's deeper liquidity, more established foreign investor infrastructure, and broader English-language support make it the easier entry point. Osaka is better suited to investors with some Japan market familiarity or those prioritizing yield.
How do I access the MLIT data for both cities?
Our platform provides official transaction data for both Tokyo and Osaka locations. Browse our location pages to compare price trends, transaction volumes, and price per square meter.
Explore the Data
- Tokyo: Shinjuku
- Tokyo: Shibuya
- Tokyo: Roppongi / Azabu
- Osaka: Umeda / Kita
- Osaka: Namba / Shinsaibashi
Disclaimer
This article provides general market comparison information based on available data and should not be considered investment advice. Property markets involve risk, and past performance does not guarantee future results. Always conduct independent due diligence and consult with qualified professionals.