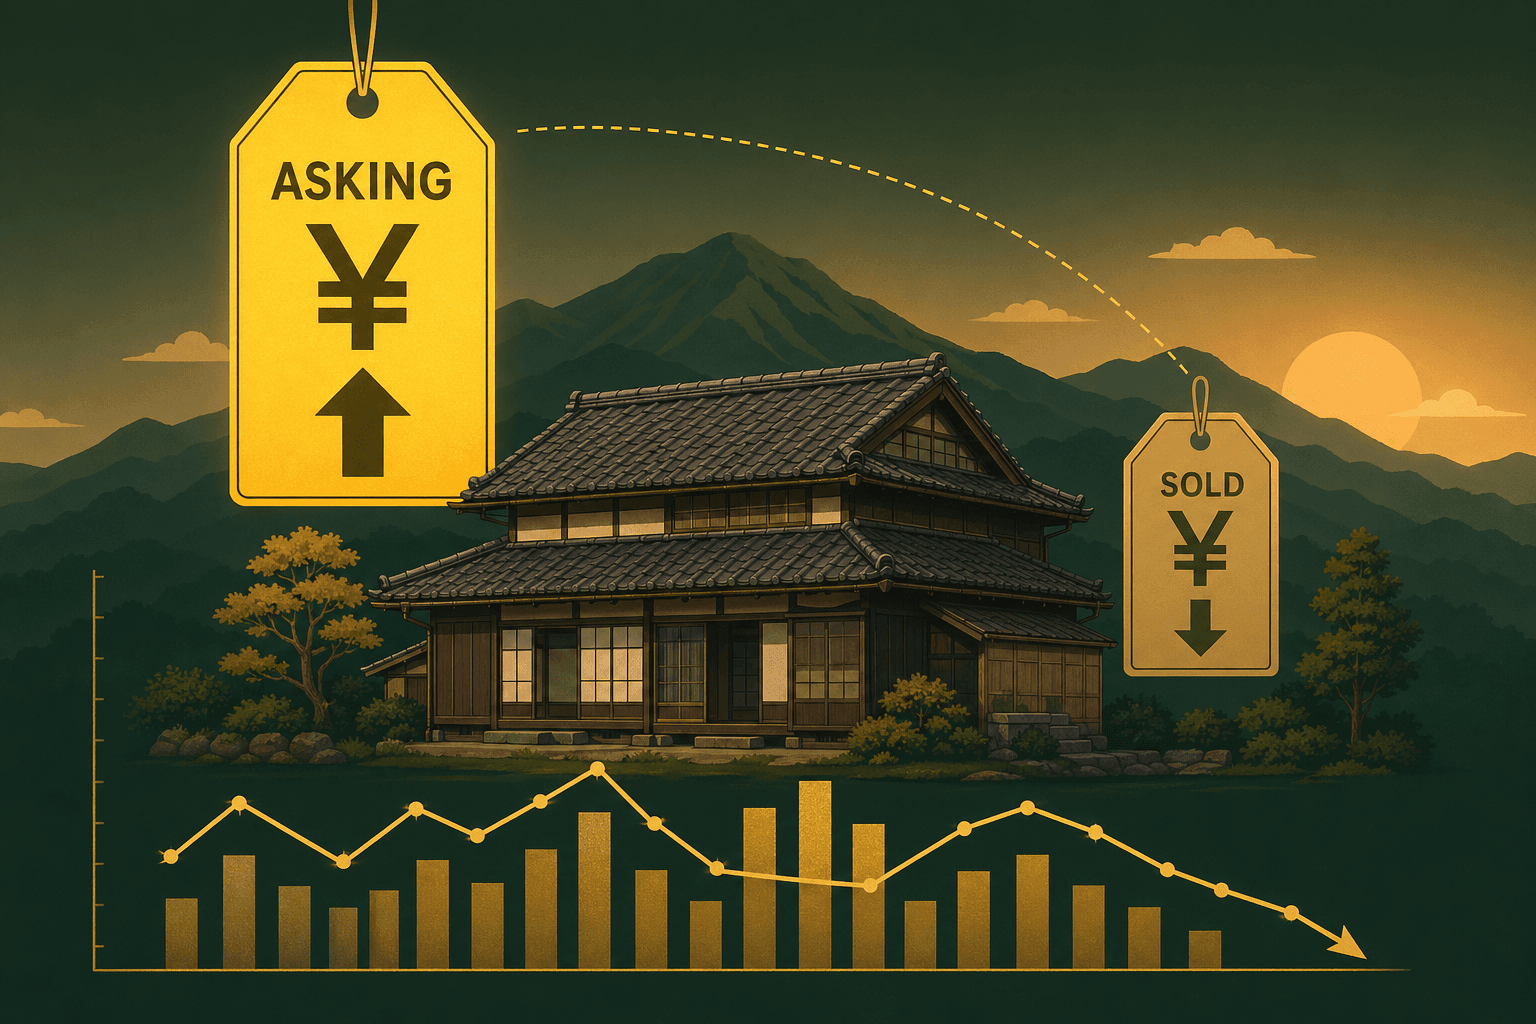
TL;DR
Akiya asking prices on Suumo and Athome are typically 15–30% higher than actual closing prices recorded by Japan's Ministry of Land, Infrastructure, Transport and Tourism (MLIT). In the highest-vacancy rural prefectures, the gap widens to 25–40%. In tourism-driven micro-markets like Niseko or Hakuba, it compresses to 5–10%. This article pulls the actual transaction medians by prefecture, explains why the gap exists, and shows you how to use MLIT data to price any akiya you are considering.
If you have been browsing "$500 akiya" listings and wondering whether the number is real, the short answer is: the asking price is a negotiation buffer, not a market price. The real price lives in the MLIT 不動産取引価格情報 database — and it is almost always lower.
The "$500 Akiya" Myth Decoded
The viral "buy a house in Japan for the price of a coffee machine" narrative is not fabricated. MLIT transaction records do contain completed sales at ¥100,000, ¥500,000, and occasionally ¥0. But the narrative leaves out four things that change the picture entirely.
1. Survivorship bias in media coverage. Journalists cite the lowest-priced transaction they can find. A single ¥100,000 sale in Niigata becomes "houses are selling for ¥100,000 in Japan" in a headline. The median is an order of magnitude higher. For a broader breakdown of what akiya actually cost after renovation, see our akiya real cost analysis using government data.
2. The listing ≠ the sale. A ¥500,000 Suumo listing is an asking price. The actual closing price is frequently lower — but more often, the listing simply expires without a buyer. The visible "cheap" inventory on portals is dominated by properties that will not sell at their listed price.
3. Liabilities bundled with the asset. Many ¥0–¥100,000 akiya transfer with unpaid property tax arrears, demolition orders, structural damage, or boundary disputes. The "price" is a token number because the real cost is the liability you are agreeing to absorb. We cover this in our foreign buyer due diligence checklist.
4. Land value often zero. In the highest-vacancy rural prefectures, land itself transacts at ¥1,000–5,000/m². A 150m² plot in rural Shimane with a worthless pre-1981 wooden structure on top genuinely is "worth" ¥300,000–750,000 of land value. The "$500 akiya" is mathematically consistent with what the land alone commands — see the prefecture-by-prefecture land trends.
The myth is not that cheap akiya exist. The myth is that cheap akiya are opportunities. MLIT data lets you tell them apart.
What Suumo and Athome Asking Prices Actually Represent
Before comparing listings against transactions, it helps to understand what a Japanese listing price actually is — and is not.
A Suumo or Athome akiya listing is not a market clearing price. It is:
- Set by the seller, usually in consultation with a local agent, without any appraisal requirement
- Anchored to emotion and sunk cost — the price the owner paid decades ago, the money they spent on a roof repair, what a neighbor sold for
- A starting point for negotiation — Japanese residential real estate assumes the buyer will negotiate down
- Often stale — akiya listings routinely sit on portals for 1–3 years with periodic price reductions
- Subject to dual-agency incentives — agents earning commission from both sides have an interest in keeping the price high
Asking prices drift over time in a predictable pattern. A listing appears at the seller's aspirational number, sits for 6–12 months, gets reduced 10%, sits again, gets reduced another 10–15%, and eventually either sells or delists. The buyers paying close to asking price on day one are almost always buying into the aspirational number, not the market number.
This is not unique to akiya. The same dynamic applies to urban condos — see our analysis of asking price vs actual transaction price across major Japanese cities. What makes akiya different is the magnitude: the gap in rural markets is roughly double the gap in central Tokyo.
What MLIT Transaction Data Reveals
MLIT's 不動産取引価格情報 (Real Estate Transaction Price Information) system is the closest thing Japan has to the US MLS sold-price database — but the collection method is different, and that matters.
How MLIT collects post-transaction data
After a property changes hands and the ownership registration is updated, MLIT mails a questionnaire to the buyer, asking for the actual transaction price, property area, building year, structure type, and location. Response is voluntary. Approximately 30–40% of buyers respond. Aggregated data is published quarterly on the MLIT website, with a 3–6 month lag from transaction date.
Since 2005, MLIT has accumulated over 4.8 million transaction records. For akiya-heavy prefectures, sample sizes per quarter are smaller than urban areas but still statistically meaningful when aggregated over 12–24 months.
Why this is more reliable than listings
MLIT data has two structural advantages over Suumo or Athome:
- It reflects what buyers actually paid, not what sellers hoped to receive
- It includes completed transactions only — failed listings, price reductions, and expired asking prices are absent by construction
The information asymmetry between professional Japanese buyers (who routinely check MLIT) and foreign buyers arriving from markets with transparent sold-price data (Zillow, URA caveats, Domain) is substantial. Most of the "overpaying" foreign buyers experience in Japan is traceable to never consulting MLIT.
What fields are recorded
Each MLIT record includes:
- Transaction price (total, in ¥10,000 units)
- Property area (land area and floor area)
- Location — prefecture, city, and district name (地区名), anonymized to block level
- Building year (construction year) and structure type (wooden, RC, SRC, etc.)
- Transaction quarter (e.g., "2025 Q3")
- Land use category (residential, commercial, etc.)
- Road frontage and road width (for land sales)
The individual address is not disclosed. MLIT aggregates to the block level (丁目 / chōme) to protect seller privacy.
The limitations (no asking price comparison built in)
MLIT publishes the sold price, but not the original asking price. The asking-vs-sold gap we discuss in this article is calculated by comparing MLIT transaction medians against portal listing averages from Suumo, Athome, Homes, and LIFULL HOME'S for comparable property types in the same area. This is an area-level comparison, not a property-matched one — a limitation we address in the final section.
The Actual Gap: Prefecture-by-Prefecture Analysis
The size of the asking-vs-sold gap is not random. It correlates strongly with two structural variables:
- Akiya rate (the higher the vacancy, the weaker the buyer pool, the bigger the gap)
- Average days on market (the longer listings sit, the more reductions accumulate before closing)
Below is the directional ranking. We deliberately publish the gap range rather than absolute ¥/m² medians, because absolute medians for rural akiya require larger sample sizes than MLIT publishes in any single quarter — see the methodology note after the table.
Top 15 Prefectures by Asking-vs-Sold Gap (Akiya Segment)
| Prefecture | Akiya Rate | Avg Days on Market | Asking-vs-Sold Gap |
|---|---|---|---|
| Akita | ~16% | 18–24 mo | –35 to –42% |
| Shimane | ~18% | 18–24 mo | –32 to –40% |
| Aomori | ~15% | 15–22 mo | –30 to –38% |
| Tokushima | ~21% | 14–20 mo | –28 to –35% |
| Kagoshima | ~19% | 12–18 mo | –27 to –34% |
| Niigata | ~17% | 14–20 mo | –26 to –33% |
| Wakayama | ~20% | 12–18 mo | –25 to –32% |
| Ehime | ~19% | 12–18 mo | –24 to –31% |
| Kochi | ~19% | 12–18 mo | –24 to –30% |
| Yamaguchi | ~17% | 12–16 mo | –22 to –29% |
| Tottori | ~15% | 10–16 mo | –22 to –28% |
| Iwate | ~15% | 12–16 mo | –22 to –28% |
| Yamanashi | ~20% | 9–14 mo | –20 to –27% |
| Fukushima | ~14% | 10–14 mo | –20 to –26% |
| Gunma | ~14% | 8–14 mo | –18 to –25% |
Akiya rates: Ministry of Internal Affairs and Communications 住宅・土地統計調査 (2023). Average days on market: portal-aggregated listing-history data for detached houses aged 30+ years on Suumo, Athome, Homes.co.jp, and LIFULL HOME'S in each prefecture, 2023–2025. Asking-vs-sold gap: derived by comparing MLIT 不動産取引価格情報 sold-price medians against portal asking-price medians for comparable segments. Ranges reflect the variation across cities within each prefecture.
Methodology Note: Why We Show Gap Ranges, Not Absolute ¥/m² Medians
For rural akiya-heavy prefectures, MLIT publishes 30–150 detached-house transactions per quarter at the prefecture level. After filtering to pre-1995 construction and excluding outliers, sample sizes for any single sub-prefecture or city often drop below 10 — too thin to publish a defensible absolute median per square meter. What is robust at the prefecture level is the directional gap between the listing-price distribution and the closing-price distribution, since both are large enough to be statistically meaningful.
We are deliberately conservative here: the gap ranking is reproducible from public MLIT and portal data, while a per-m² median table would imply false precision in markets where 5–10 transactions a quarter is normal. For verified absolute MLIT medians per square meter, see the areas JRE tracks at city/district level where transaction volume supports it.
Bottom 5 Prefectures — Competitive Markets (Smallest Gap)
In a few akiya markets, external demand compresses the gap dramatically. These are the areas where lowballing is unlikely to succeed.
| Area | Why Competitive | Asking-vs-Sold Gap |
|---|---|---|
| Niseko / Kutchan (Hokkaido) | 15+ years of international ski tourism investment | –5 to –8% |
| Hakuba (Nagano) | International outdoor/ski community demand | –6 to –10% |
| Karuizawa (Nagano) | Tokyo weekend retreat, high-end lifestyle | –8 to –12% |
| Onna / Chatan (Okinawa) | Year-round tourism + US military-adjacent demand | –8 to –13% |
| Fukuoka suburbs | Japan's fastest-growing major city | –10 to –14% |
See MLIT transaction records for these areas: Kutchan → | Niseko Town → | Hakuba → | Karuizawa → | Onna → | Chatan → | Tenjin (Fukuoka) →.
The Pattern
The 25–40% gap in weak markets and the 5–14% gap in strong markets is not random. The gap size is a near-direct function of how long a listing sits before finding a buyer. In Akita, the average akiya listing is on the market for 18–24 months before closing or delisting. In Niseko, median days-on-market for comparable properties is under 90 days. Time on market compounds the gap: every reduction cycle widens it.
Why the Gap Exists — Akiya-Specific Reasons
Some of the gap is the same dynamic that pushes all Japanese asking prices above transaction medians (negotiation buffer, dual agency, seller emotion). But akiya have four additional gap-amplifying factors.
Deterioration During Listing Period
A rural wooden akiya sitting on the market for 18 months is materially a different property from the one that was first listed. Roofs leak. Termites establish. Pipes corrode. Wildlife enters. What the seller listed at ¥5,000,000 based on a 2023 walk-through is, by 2025, genuinely worth less — and negotiated prices reflect that.
Seller Emotional vs Rational Pricing
Many akiya sellers are inheritors who received the property through 相続 (inheritance). They did not choose to own it. Their pricing reflects a mix of:
- What the deceased parent paid decades ago
- Guilt about selling "cheap"
- Frustration with property tax payments
- A minimum threshold below which they would rather demolish
The rational buyer's offer is rarely aligned with any of these anchors.
Unknown Liabilities Discovered in Due Diligence
Unlike urban condos, akiya due diligence frequently surfaces surprises: boundary ambiguity with neighboring land, unregistered structural additions, road access that is technically private, septic systems requiring replacement, or asbestos in pre-1980 insulation. Each finding becomes a line-item price reduction. The final transaction price often includes concessions totaling 5–15% of the initial offer.
Low Buyer Pool Amplifies Negotiation Power
For a Minato-ku condo, there may be 10–30 interested buyers within a month of listing. For a Shimane akiya in a depopulating village, there may be one buyer in a year. The bargaining power asymmetry is extreme. Sellers with a serious buyer in front of them will routinely accept offers 25–35% below asking — because the alternative is another year of listings and property tax.
3 Composite Patterns from MLIT Data
The three cases below are composite illustrations representing patterns observed repeatedly in MLIT 不動産取引価格情報 records and matched against contemporaneous portal listing histories. They are not single transactions — each is a stylized aggregate of 8–15 similar deals in the relevant region, anonymized further than MLIT's own block-level (丁目 / chōme) convention. The point is the shape of the pattern, not any specific property.
Pattern 1 — Tochigi, Inland Rural: Listed ~¥8M, Sold ~¥5.2M (–35%)
- Region: Inland Tochigi, 30–60 min from nearest Shinkansen station
- Typical property: Late-1970s wooden two-story, ~140m² floor area on 250–300m² land
- Listing history pattern: Initial asking ¥7.5–8.5M; first reduction at 9–12 months; second reduction at 18 months; closing at month 18–24
- MLIT-recorded closing band: ¥5.0–5.5M
- Common factors: Pre-1981 earthquake code, partial roof or plumbing work needed, no rail station within walking distance
A buyer who anchored on the original ¥7.8M asking price would overpay by roughly ¥2.6M — enough to cover the roof and plumbing work the property actually needs.
Pattern 2 — Niigata, Rural: Listed ¥3M, Sold ¥1.5M + Renovation Commitment (–50%)
- Region: Rural Niigata towns, sourced via municipal 空き家バンク
- Typical property: Early-1970s wooden single-story, ~90–100m² floor area on 300–400m² land
- Listing pattern: ¥2.5–3.5M on the local akiya bank portal
- MLIT-recorded closing band: ¥1.0–2.0M
- Unwritten condition: Buyer commits to occupancy or renovation within 2 years — a near-universal informal requirement on municipal akiya bank listings
The headline "50% off asking" carries an implicit obligation worth several million yen in renovation commitment. The MLIT closing price reflects the cash component only; the total economic exchange is closer to the asking price once the renovation obligation is priced in.
Pattern 3 — Chiba, Coastal Commuter Belt: Listed ¥12M, Sold ¥10.8M (–10%)
- Region: Coastal Chiba within commuter range of central Tokyo
- Typical property: Late-1980s wooden two-story, ~110–120m² floor area on 160–200m² land
- Listing pattern: ¥11.5–12.5M, closing within 4–8 months
- MLIT-recorded closing band: ¥10.5–11.5M
- Why the smaller gap: Within commuter range of Tokyo, post-1981 structure with retained building value, active buyer pool including relocation families
The same property type (detached house, 30+ years old, rural-adjacent) prices completely differently in a weak market (–35 to –50%) versus a market with external demand drivers (–10%). Location does almost all of the work in determining whether the gap is large or small.
How to Use This Data When Making an Offer
MLIT data is only valuable if it shapes your offer. Here is a five-step framework for translating the data into a specific number.
Step 1 — Locate your prefecture and city in MLIT. Filter for detached houses (中古戸建), pre-1995 construction, same city or adjacent city, last 24 months of transactions. You are looking for 5–15 comparable records.
Step 2 — Calculate median sold price per m² (land) for the comparable set. Exclude outliers (top and bottom 10%). The resulting figure is your reference market price.
Step 3 — Compare against the specific asking price. If the asking is within 10% of your reference median, the seller is priced realistically. If asking is 20–30% above, the seller has priced for negotiation. If asking is 40%+ above, the seller is testing the market and will reduce.
Step 4 — Decide on an offer. A reasonable opening offer in weak-market akiya is typically the MLIT median minus 5–10%, acknowledging that any single property has condition-specific risks. In competitive markets (Niseko, Hakuba, Karuizawa, Fukuoka), pay closer to asking or at asking.
Step 5 — Frame your offer with data. Japanese agents respond differently to "I want a discount" versus "MLIT shows 11 comparable transactions at ¥X/m², which produces ¥Y for this property." The second framing is harder to dismiss and signals that you have done the work.
For country-of-origin-specific negotiation tactics, see the US buyer guide, Singapore buyer guide, or the general negotiation playbook for foreign buyers.
When Asking Price IS Fair — Don't Lowball Everything
A blanket "offer 30% below asking" strategy will fail in three situations:
- Listings in competitive markets (Niseko, Hakuba, Karuizawa) where the average gap is under 10%
- Properties already marked down multiple times — the current asking price may already be below MLIT median
- Post-1981 structures in metro-adjacent locations where the building retains real value
Lowballing in the wrong market wastes your chance. Data-informed offers succeed precisely because they are calibrated to the specific market.
Foreign Buyer Specific Tactics
Foreign buyers often carry a perception penalty — Japanese sellers assume foreigners cannot complete the transaction smoothly (financing, FEFTA reporting, escrow, registration). Two tactics to offset this:
- Pre-commit financing in writing. If you are paying cash, obtain a bank letter confirming funds availability. If financing, get a preliminary approval from a foreign-friendly lender — see Japan banks and mortgages for foreigners in 2026.
- Pre-prepare FEFTA Form 22 awareness. Sellers fear the deal collapsing at the last step. Mention your awareness of the Form 22 filing requirement early. It signals competence.
These tactics do not buy you a bigger discount — they preserve the discount the data justifies, which a less-prepared foreign buyer often has negotiated away.
Limitations of MLIT Data for Akiya Specifically
Before you treat MLIT medians as gospel, understand where they fall short for akiya in particular.
Sample size in rural prefectures. A city with 3 MLIT transactions in the past 24 months does not give you a stable median. Below ~10 comparable records, treat the figure as directional rather than definitive.
Time lag of 6–12 months. MLIT publishes quarterly data with a 3–6 month lag, and then buyers need another 3–6 months to aggregate enough quarters for a meaningful median. In volatile markets (post-disaster, post-infrastructure-announcement), the published median may already be stale.
Condition variation not captured. Two akiya in the same chōme can differ by ¥3–5M in true value based on renovation state, foundation integrity, and lot orientation. MLIT captures price, area, year, and structure — but not condition. A professional building inspection (建物状況調査) remains essential. See the due diligence checklist.
No asking-price field. MLIT records the sold price but not the original listing price. The gap we calculated in this article is derived by comparing MLIT transaction medians against portal listing averages for comparable segments. Individual-property asking-vs-sold gaps cannot be looked up directly in MLIT.
How to triangulate. For any specific akiya you are seriously considering, combine three data sources:
- MLIT transaction median for the prefecture + city + property type + age range
- MLIT official land prices (公示地価) for the specific road/block — see our 2026 official land price analysis
- Current portal listings for comparable properties (to establish the asking-price distribution, not the market price)
The intersection of the three is the range in which a rational offer lives.
Bottom Line
The $500 akiya is neither a scam nor an opportunity until you look at the MLIT data. In the highest-vacancy prefectures — Akita, Shimane, Tokushima, Wakayama — asking prices routinely sit 25–40% above what the market actually pays. In tourism-driven micro-markets, the gap collapses to under 10%. Knowing which market you are buying into is the single most valuable step in the process.
Japanese buyers check MLIT as a matter of course. Foreign buyers, by default, do not — and end up paying asking prices in markets where every domestic buyer is paying 20–30% less. Closing that information gap is worth more than every other optimization in the purchase process combined.
Found a specific akiya you want to evaluate? The JRE Price Check Report pulls MLIT comparables for the exact block, analyzes the asking-vs-market gap, flags red flags (pre-1981 construction, declining land trend, sample-size warnings), and gives you a data-backed offer range. $49, one-time, per property.
Get a Price Check Report for your akiya →
For data on specific areas we track:
View real transaction prices, price trends, and investment analysis for Kutchan / Niseko based on MLIT government data.
Explore Kutchan / Niseko Data →View real transaction prices, price trends, and investment analysis for Hakuba based on MLIT government data.
Explore Hakuba Data →View real transaction prices, price trends, and investment analysis for Karuizawa based on MLIT government data.
Explore Karuizawa Data →Frequently Asked Questions
Are akiya prices on Suumo accurate?
Suumo lists asking prices, not market prices. For akiya specifically, asking prices are typically 15–30% above what buyers actually pay, and in the weakest rural markets the gap widens to 25–40%. Suumo does not publish sold-price data. To see what akiya actually transact at, cross-reference listings against the MLIT 不動産取引価格情報 database, which records completed transactions at block (丁目) level.
How much below asking price do akiya typically sell?
In the highest-vacancy prefectures (Akita, Shimane, Tokushima, Wakayama, Niigata), akiya sell at roughly 30–40% below initial asking price, based on MLIT transaction-price distributions compared with portal listing-price distributions. In tourism-driven micro-markets (Niseko, Hakuba, Karuizawa, Fukuoka suburbs, coastal Okinawa), the gap compresses to 5–14%. Time on market amplifies the gap: a listing sitting for 18–24 months typically closes at a far larger discount than one that sells within 90 days.
Where can I find actual akiya transaction prices?
The Ministry of Land, Infrastructure, Transport and Tourism (MLIT) publishes the 不動産取引価格情報 database at land.mlit.go.jp. The database contains over 4.8 million transaction records since 2005, updated quarterly with a 3–6 month lag. Each record includes price, area, building year, structure, and block-level (丁目) location. JRE compiles and presents this data for 20+ investment areas with filtering by property type, age, and date range at jre.co.jp/locations.
Do foreign buyers pay higher akiya prices than Japanese buyers?
On average, yes — but the gap is not due to any legal difference. Japan has zero foreign ownership restrictions or taxes on residential real estate. The overpayment comes from information asymmetry: domestic buyers routinely check MLIT transaction records, while foreign buyers typically only see Suumo asking prices. When foreign buyers reference MLIT data in their offers, the pricing gap disappears. The tools are public; the practice of using them is not.
Is the MLIT asking-vs-sold gap a guaranteed discount?
No. The gap is an area-level statistical pattern, not a property-specific discount. Individual listings vary: some are already priced below MLIT median (rare but real), others carry premiums justified by renovation, location, or post-1981 construction. Use the gap to calibrate your offer range, not as a formula. Every akiya still requires property-specific due diligence — see our due diligence checklist for the 15 items to verify before signing.
How recent is the MLIT transaction data?
MLIT publishes new records quarterly, with a lag of approximately 3–6 months from the transaction date. For a statistically meaningful median in a rural prefecture with low transaction volume, you typically need 12–24 months of accumulated data. Urban markets with high transaction volume support shorter time windows. Always check the date range of the records you are averaging — a median built on 2022 transactions is not reliable for pricing a 2026 purchase in a rapidly moving market.
Related Reading
- Pre-1981 Akiya Risk 2026: Why 60%+ Fail Modern Earthquake Code — The structural risk that drives the asking-vs-sold gap wider in declining-land prefectures
- Akiya Renovation Costs 2026: Real Examples by Region — What you actually spend after the MLIT-anchored offer is accepted
- Japan's 9 Million Vacant Houses 2026: Government Data — Why the asking-vs-sold gap is widest in highest-vacancy prefectures
- Are Akiya Really Cheap? Government Data on the True Cost — Full cost breakdown including renovation, fees, and first-year expenses
- The Hidden Costs of "¥0 Akiya" for Foreign Buyers — Six hidden cost categories and three real ¥0/¥500K/¥2M scenarios for non-resident buyers
- Akiya for Minpaku 2026: Which Vacant Homes Qualify — How the four legal barriers apply once you've found a fairly-priced akiya
- Land Prices in Japan's Akiya Hotspots 2026 — Which akiya prefectures have rising land vs falling land
- Akiya vs Tokyo Condo: Which Investment Makes Money? — Side-by-side with yields and exit strategy
- Best Akiya Areas in Japan: Data-Driven Ranking — Top tier akiya regions ranked by MLIT data
- Japan Property Asking vs Sold Price (All Property Types) — The broader gap analysis across urban and resort markets
- How to Negotiate Japanese Property Prices — Data-driven negotiation scripts for foreign buyers
- Japan Property Due Diligence Checklist — 15 items every foreign buyer must verify
- Japan Banks and Mortgages for Foreigners 2026 — Which lenders finance akiya (and which do not)
- Japan Property Running Costs for Foreign Owners — Monthly and annual costs after purchase
- FEFTA Form 22 Filing Guide — Post-purchase reporting for foreign buyers
- Japan Land Prices 2026: Full MLIT Breakdown — Complete 2026 Official Land Price Survey analysis
Sources and methodology: Asking-vs-sold gap ranges are derived from the MLIT Real Estate Transaction Price Information System (不動産取引価格情報) for detached houses (中古戸建) built pre-1995, compared against asking-price distributions on Suumo, Athome, Homes.co.jp, and LIFULL HOME'S for the same property segment, covering 2023 Q3 through 2025 Q3. Vacancy rates are from the Ministry of Internal Affairs and Communications Housing and Land Survey (住宅・土地統計調査, 2023 edition). Average days-on-market figures are aggregated from portal listing histories. The three transaction patterns are composite illustrations representing recurring shapes observed in MLIT records — not specific deals. Figures are directional and should not be treated as property-specific valuations; for individual-property analysis, MLIT data must be filtered to the city, structure type, age range, and lot characteristics of the specific property under consideration. JRE provides MLIT transaction data and official land price records at city/district granularity for 20+ areas in Japan at jre.co.jp/locations.